Spectra Documentation

GPU plotting docs for serious workbench workflows

Build, embed, automate, and inspect Spectra: a C++20 and Python plotting system with Vulkan rendering, interactive tools, adapters, and an experimental WebGPU path.

Vulkan 1.2+ 2D + 3D C++20 + Python Interactive + headless
Coreplotting, UI, export
AdaptersROS2, PX4, Qt
Runtimeinproc + IPC
WebGPUexperimental 2D
Spectra Docs Workbench plot stack online
pan inspect export linked axes

Feature Map

Spectra spans rendering, interaction, animation, desktop workflows, and Python interoperability.

Rendering Engine

  • Vulkan 1.2+ GPU backend
  • 2D + 3D plotting pipelines
  • Depth buffer + MSAA + high-quality text

Interactive Workflows

  • Multi-window tabs + docking + split view
  • Crosshair, markers, linked axes, shared cursor
  • Undo/redo, command palette, configurable shortcuts

Animation + Automation

  • Frame callbacks and real-time streaming
  • Timeline editor + keyframe interpolation
  • PNG/GIF/MP4 export and Python IPC bridge

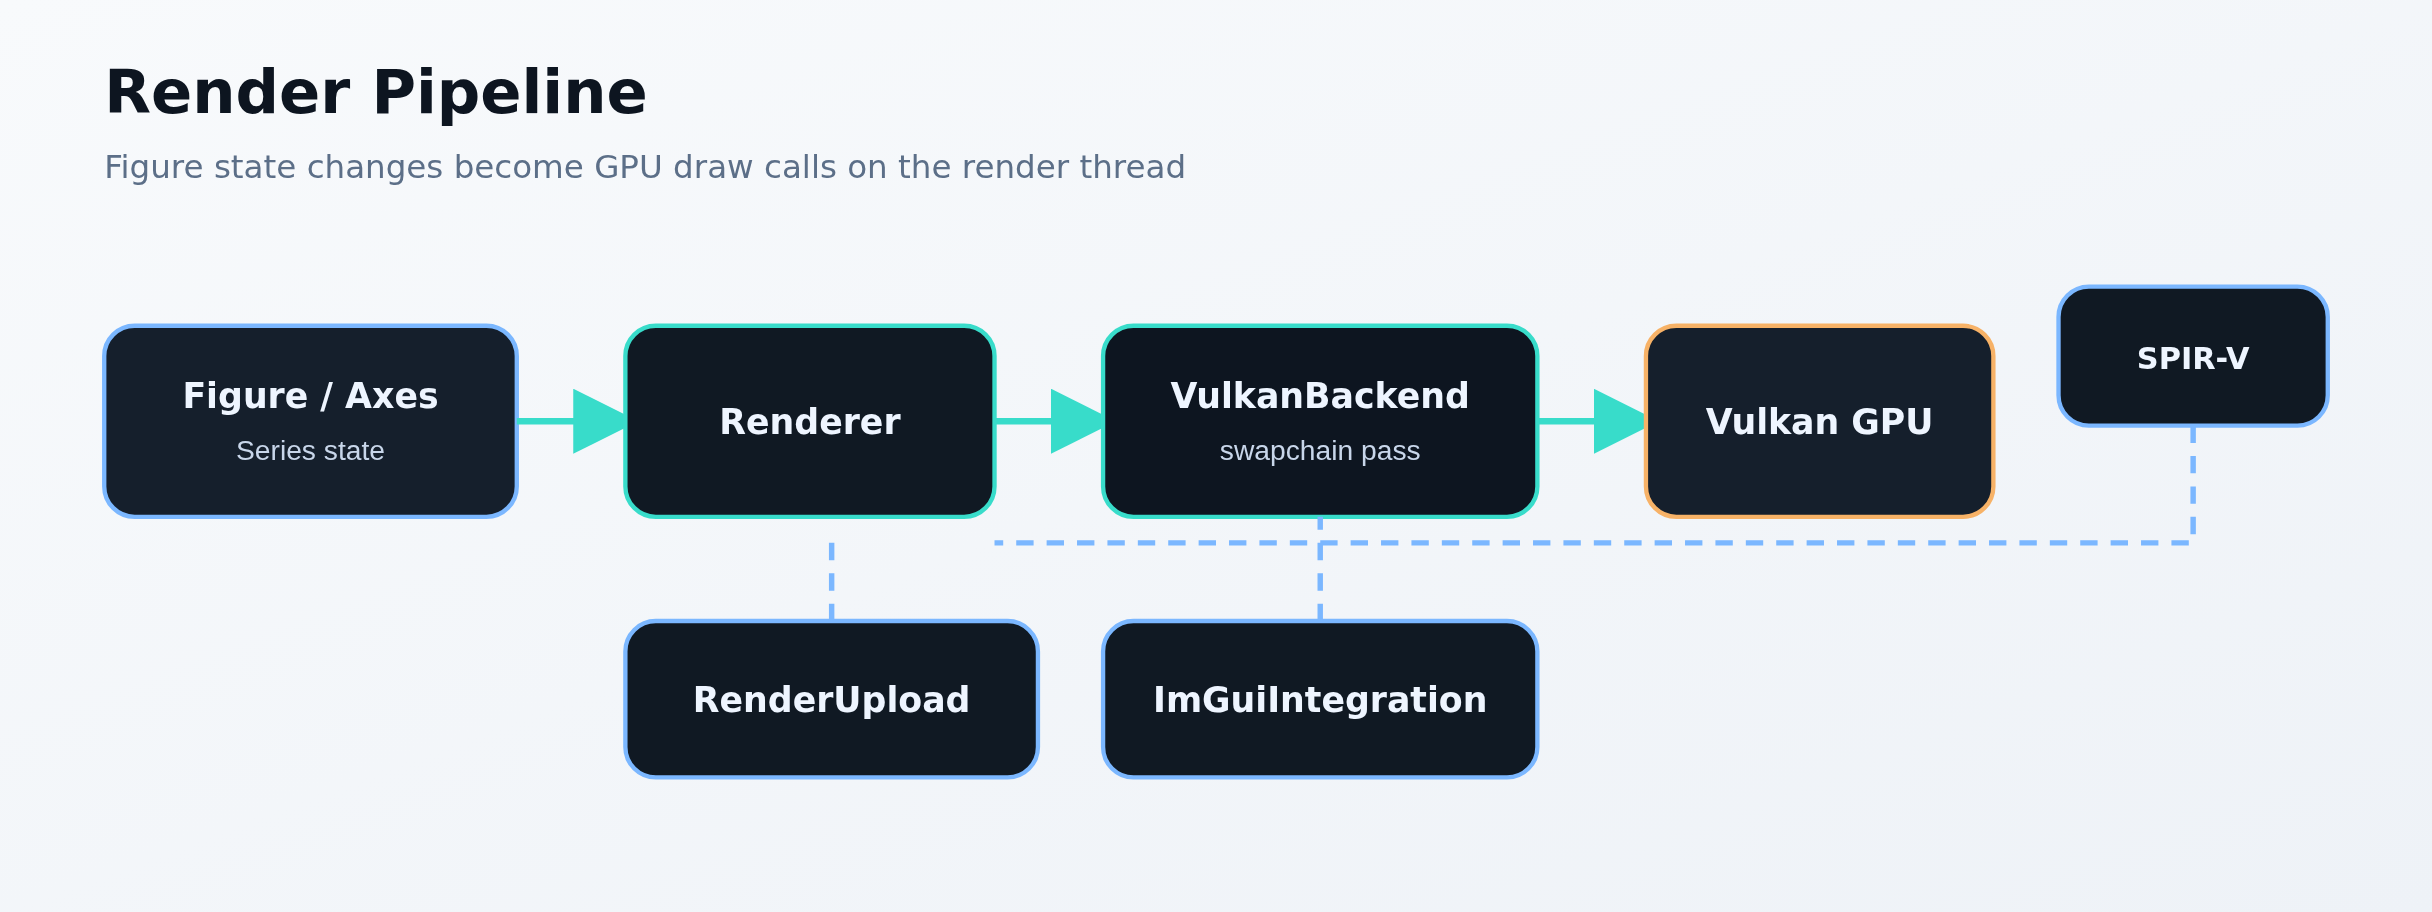
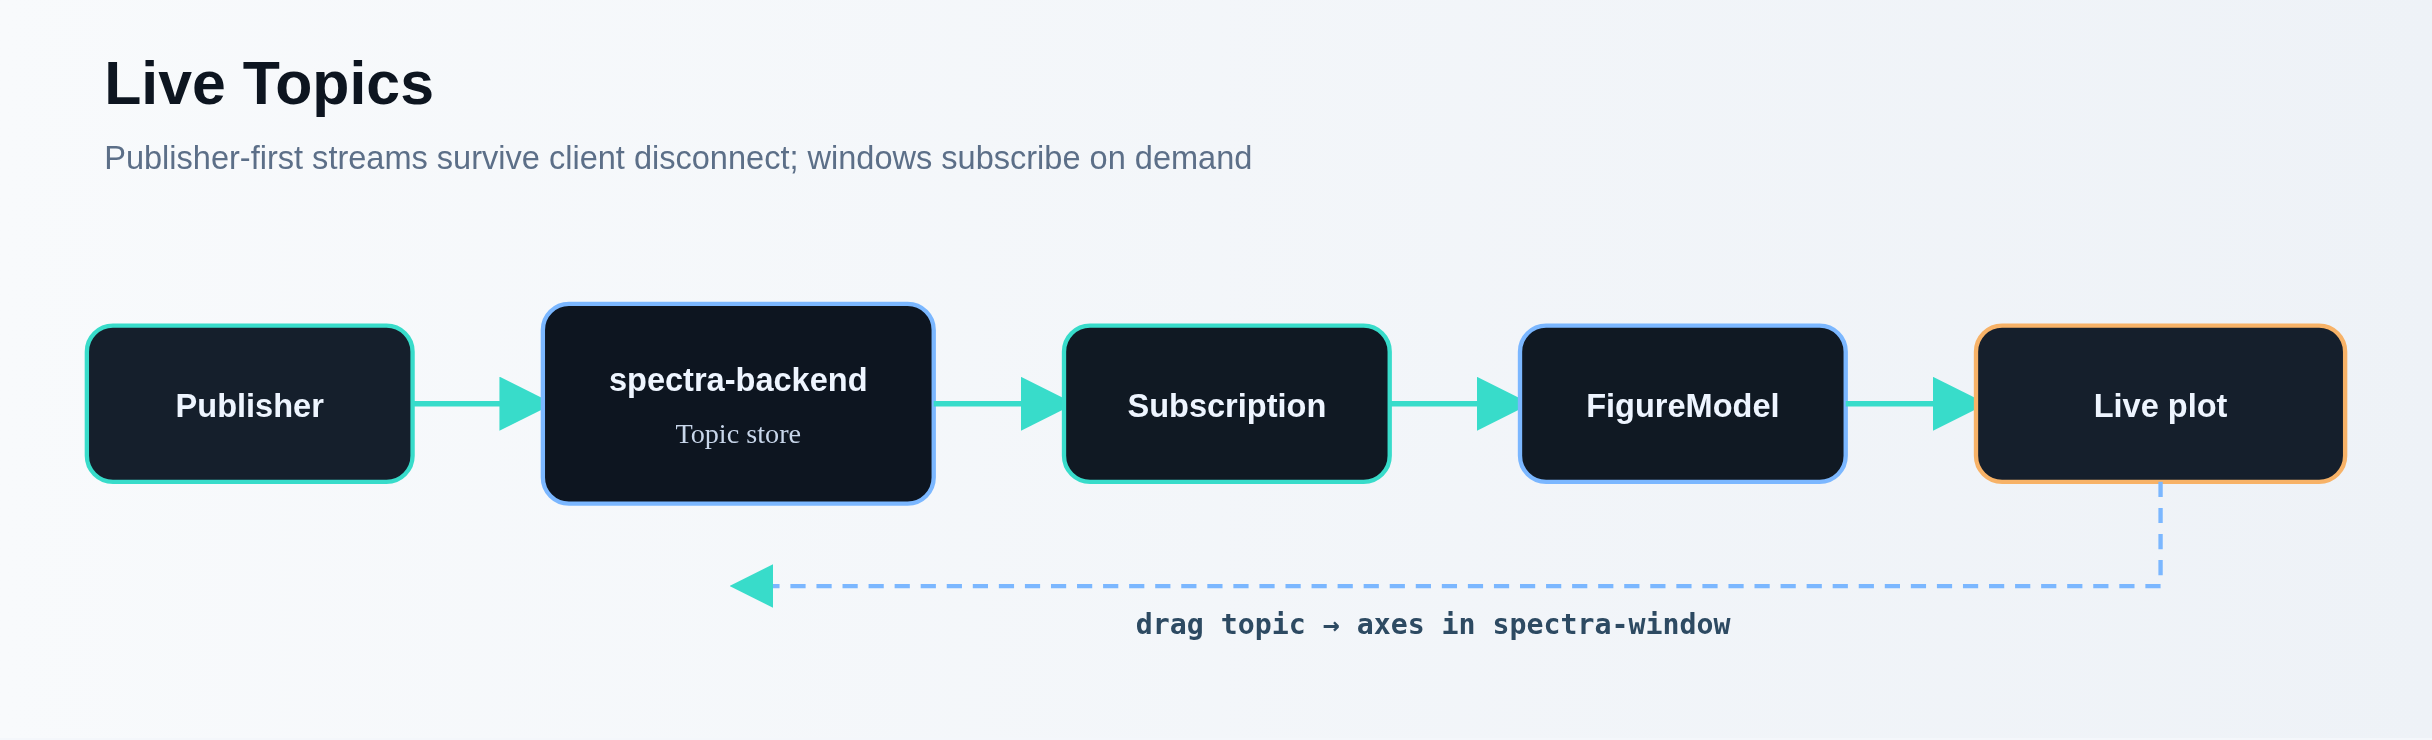
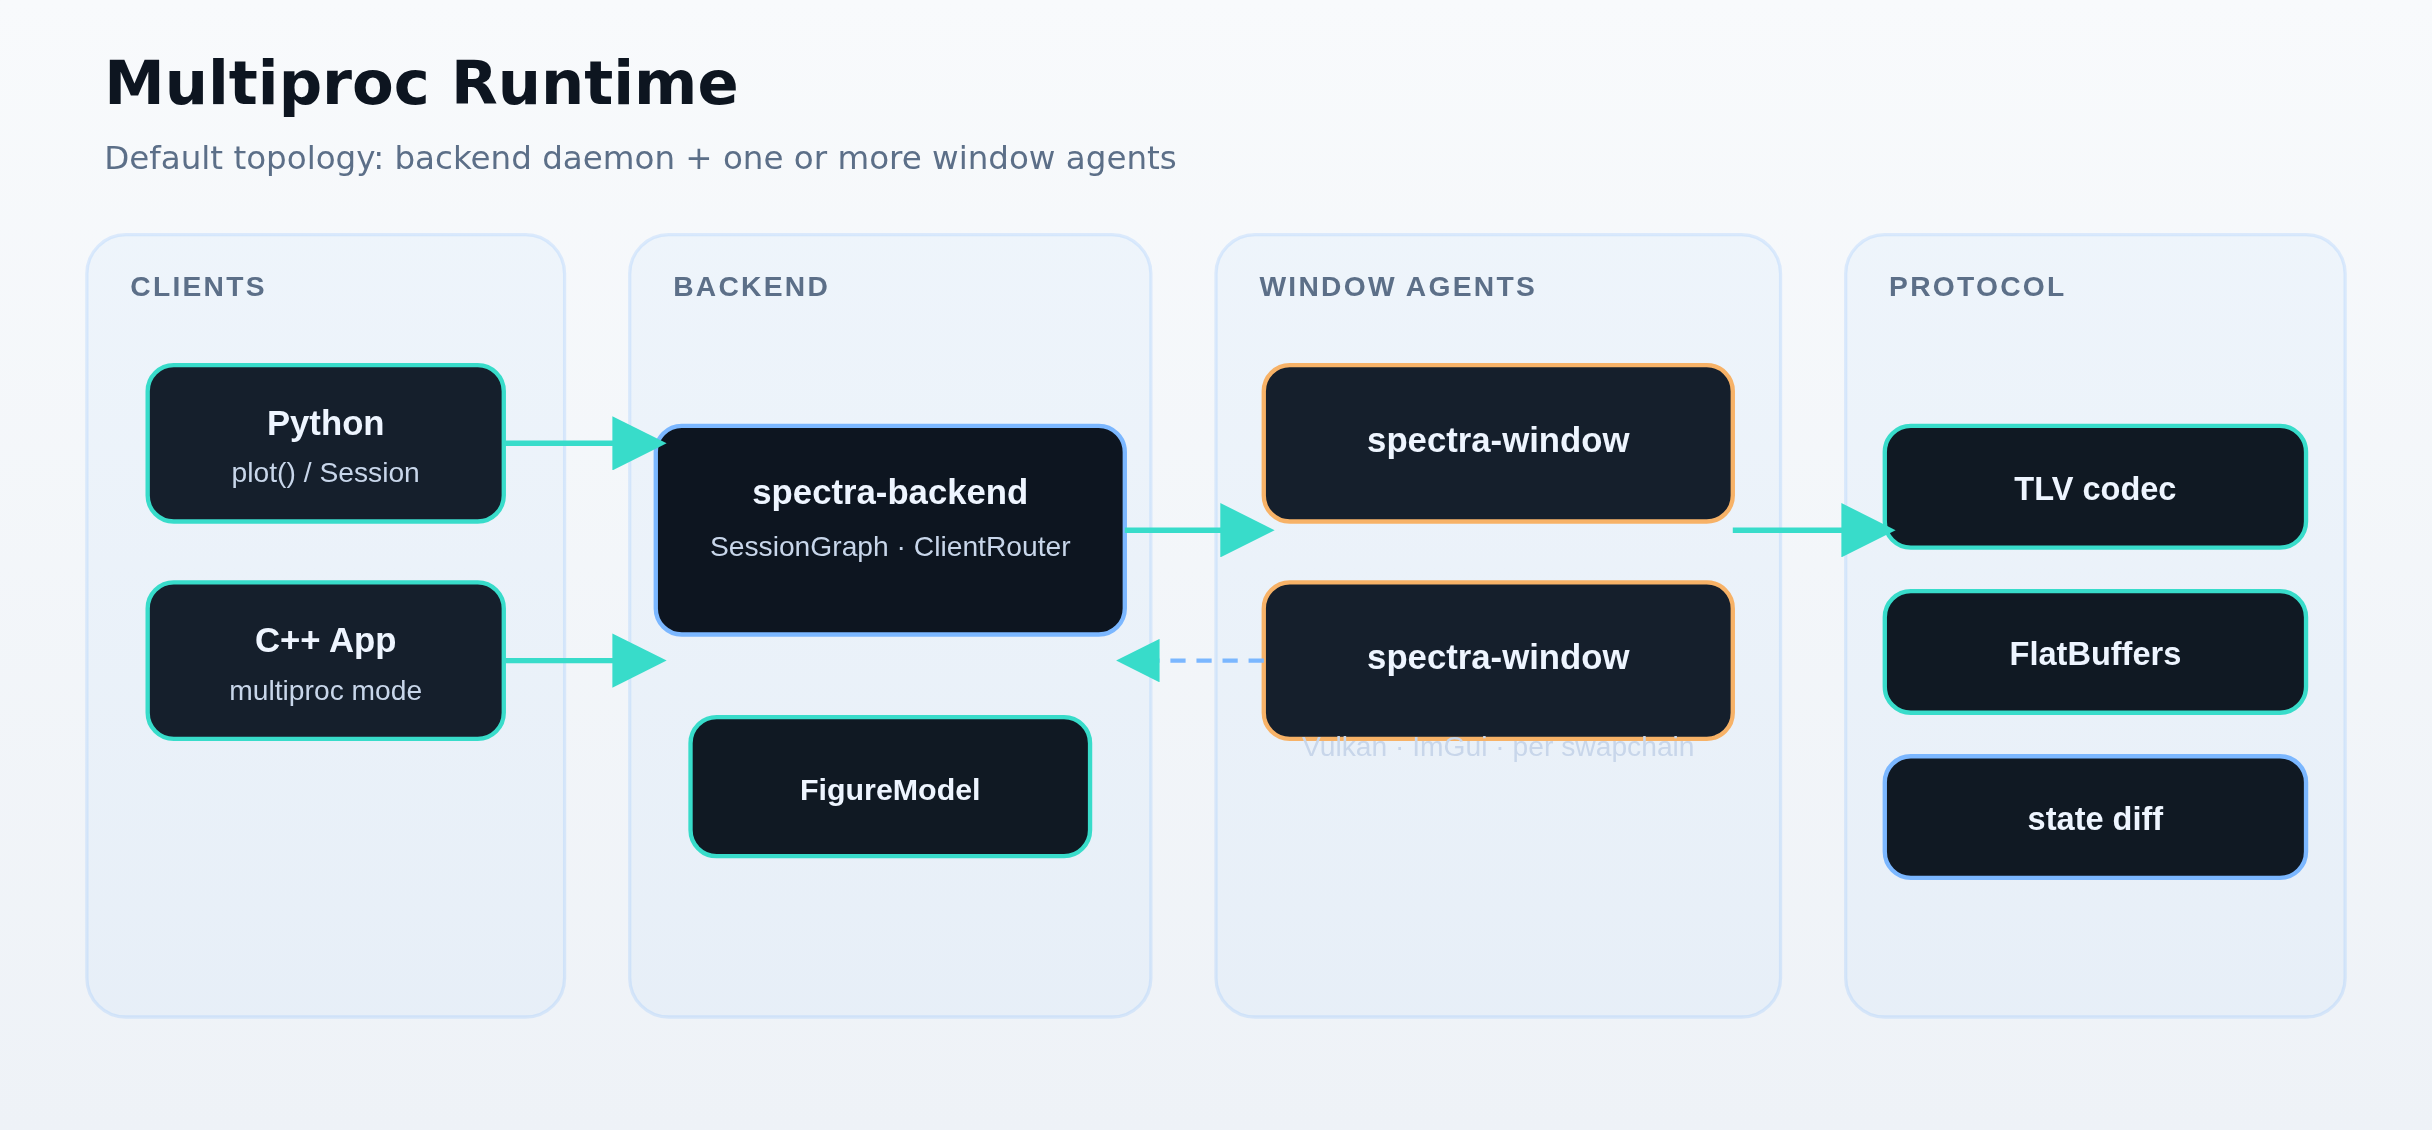
Architecture Diagrams

Visual maps for runtime topology, GPU pipeline, and live topics.
Browse by Topic

Prefer smaller pages? Use these focused guides.

Core Rendering

GPU Pipeline

  • Explicit Vulkan resource and frame management
  • Asynchronous uploads and multi-buffered rendering
  • Depth-tested rendering with optional 4x MSAA

2D Plot Quality

  • Anti-aliased lines with SDF smoothing
  • 18 marker types and dash pattern support
  • MATLAB-style format strings (e.g., "r--o")

3D Visualization

Series + Shading

  • LineSeries3D, ScatterSeries3D, SurfaceSeries, MeshSeries
  • Blinn-Phong lighting and material controls
  • Colormaps: Viridis, Plasma, Inferno, Magma, Jet, Coolwarm, Grayscale

Camera + Scene

  • Quaternion-based orbit camera with pan/zoom
  • Wireframe mode and transparency sorting
  • 3D axes, grids, bounding box, depth-aware tick labels

Easy API (MATLAB-style)

Start with one-liners, scale to full object control when needed.

2D + Statistical

  • plot(), scatter(), subplot()
  • histogram(), bar(), box_plot(), violin()
  • Axis titles, labels, limits, legends, and styling helpers

3D + State Access

  • plot3(), scatter3(), surf(), mesh()
  • Window + tab helpers (figure(), tab())
  • MATLAB-like accessors (gcf(), gca(), cla())

Animation & Recording

Real-time Engine

  • Frame callbacks with configurable FPS
  • Stable frame scheduling + delta-time updates
  • Live streaming append paths

Timeline Tools

  • Timeline editor with play/pause/scrub
  • 7 keyframe interpolation modes
  • Curve editor with tangent controls

Output Formats

  • PNG sequences
  • GIF export with built-in quantization
  • MP4 export through ffmpeg pipeline

UI & Productivity

Workflow Acceleration

  • Command palette (Ctrl+K)
  • Custom shortcuts with JSON persistence
  • Undo/redo with grouped operations

Workspace Management

  • Multi-figure tabs and tab context operations
  • Docking + split panes + drag-to-dock
  • Workspace save/load with backward compatibility

Data Interaction

Exploration

  • Nearest-point hover tooltips
  • Crosshair overlays with axis labels
  • Persistent data markers

Coordination

  • Multi-axis linking across subplots
  • Shared cursor + interpolated Y readout
  • Linked zoom/pan/auto-fit behaviors

Transform Pipeline

  • 14 built-in data transforms
  • Chained transform pipelines
  • Custom transform registration

Themes & Accessibility

Theme System

  • Dark and light themes
  • Design tokens for spacing, color, typography
  • Theme export/import in JSON

Accessible Visualization

  • 8 colorblind-safe palettes
  • CVD simulation modes
  • WCAG contrast utilities

Multi-Window & Multi-Process

Window Runtime

  • Independent OS windows with per-window swapchains
  • Tab tear-off into new windows
  • Stable figure ownership with FigureId

Dual Runtime Modes

  • In-process mode for local app workflows
  • Multi-process mode: backend daemon + window agent
  • Protocol-driven state sync and diffs

Python API

Core API

  • Figure/Axes/Series proxy model over IPC
  • Easy one-liners: spectra.plot(), spectra.scatter(), spectra.show()
  • 3D support: plot3(), scatter3(), surf(), mesh()

Performance + Streaming

  • Thread-safe live streaming API
  • NumPy fast path for array transfer
  • Automatic backend launch and session management

Export & Integration

Headless Rendering

  • Offscreen rendering for CI and servers
  • Deterministic image output workflows

Packaging

  • CMake install + find_package(spectra)
  • Linux, macOS, Windows release artifacts
  • AppImage, Homebrew, AUR, Python wheels

Optional Extensions

  • FFmpeg-backed MP4 export flag
  • Optional Eigen adapters
  • Plugin API for external command extensions

Quality & Reliability

Verification

  • 1,200+ unit tests
  • Golden image regression tests for 2D and 3D
  • Integration tests + benchmarks

CI + Release

  • Cross-platform CI (Linux/macOS/Windows)
  • Sanitizer jobs and release packaging
  • Automated artifact publishing workflows

Quick Start (C++)

#include <spectra/easy.hpp>

int main() {
    std::vector<float> x = {0.f, 1.f, 2.f, 3.f};
    std::vector<float> y = {0.f, 1.f, 0.5f, 1.5f};

    spectra::plot(x, y, "c-o").label("example");
    spectra::title("Spectra Feature Demo");
    spectra::xlabel("X");
    spectra::ylabel("Y");
    spectra::show();
}

For deeper usage, see the repository README and docs directory.