Rendering Engine
- Vulkan 1.2+ GPU backend
- 2D + 3D plotting pipelines
- Depth buffer + MSAA + high-quality text
Spectra Documentation
Build, embed, automate, and inspect Spectra: a C++20 and Python plotting system with Vulkan rendering, interactive tools, adapters, and an experimental WebGPU path.
Spectra spans rendering, interaction, animation, desktop workflows, and Python interoperability.
Visual maps for runtime topology, GPU pipeline, and live topics.
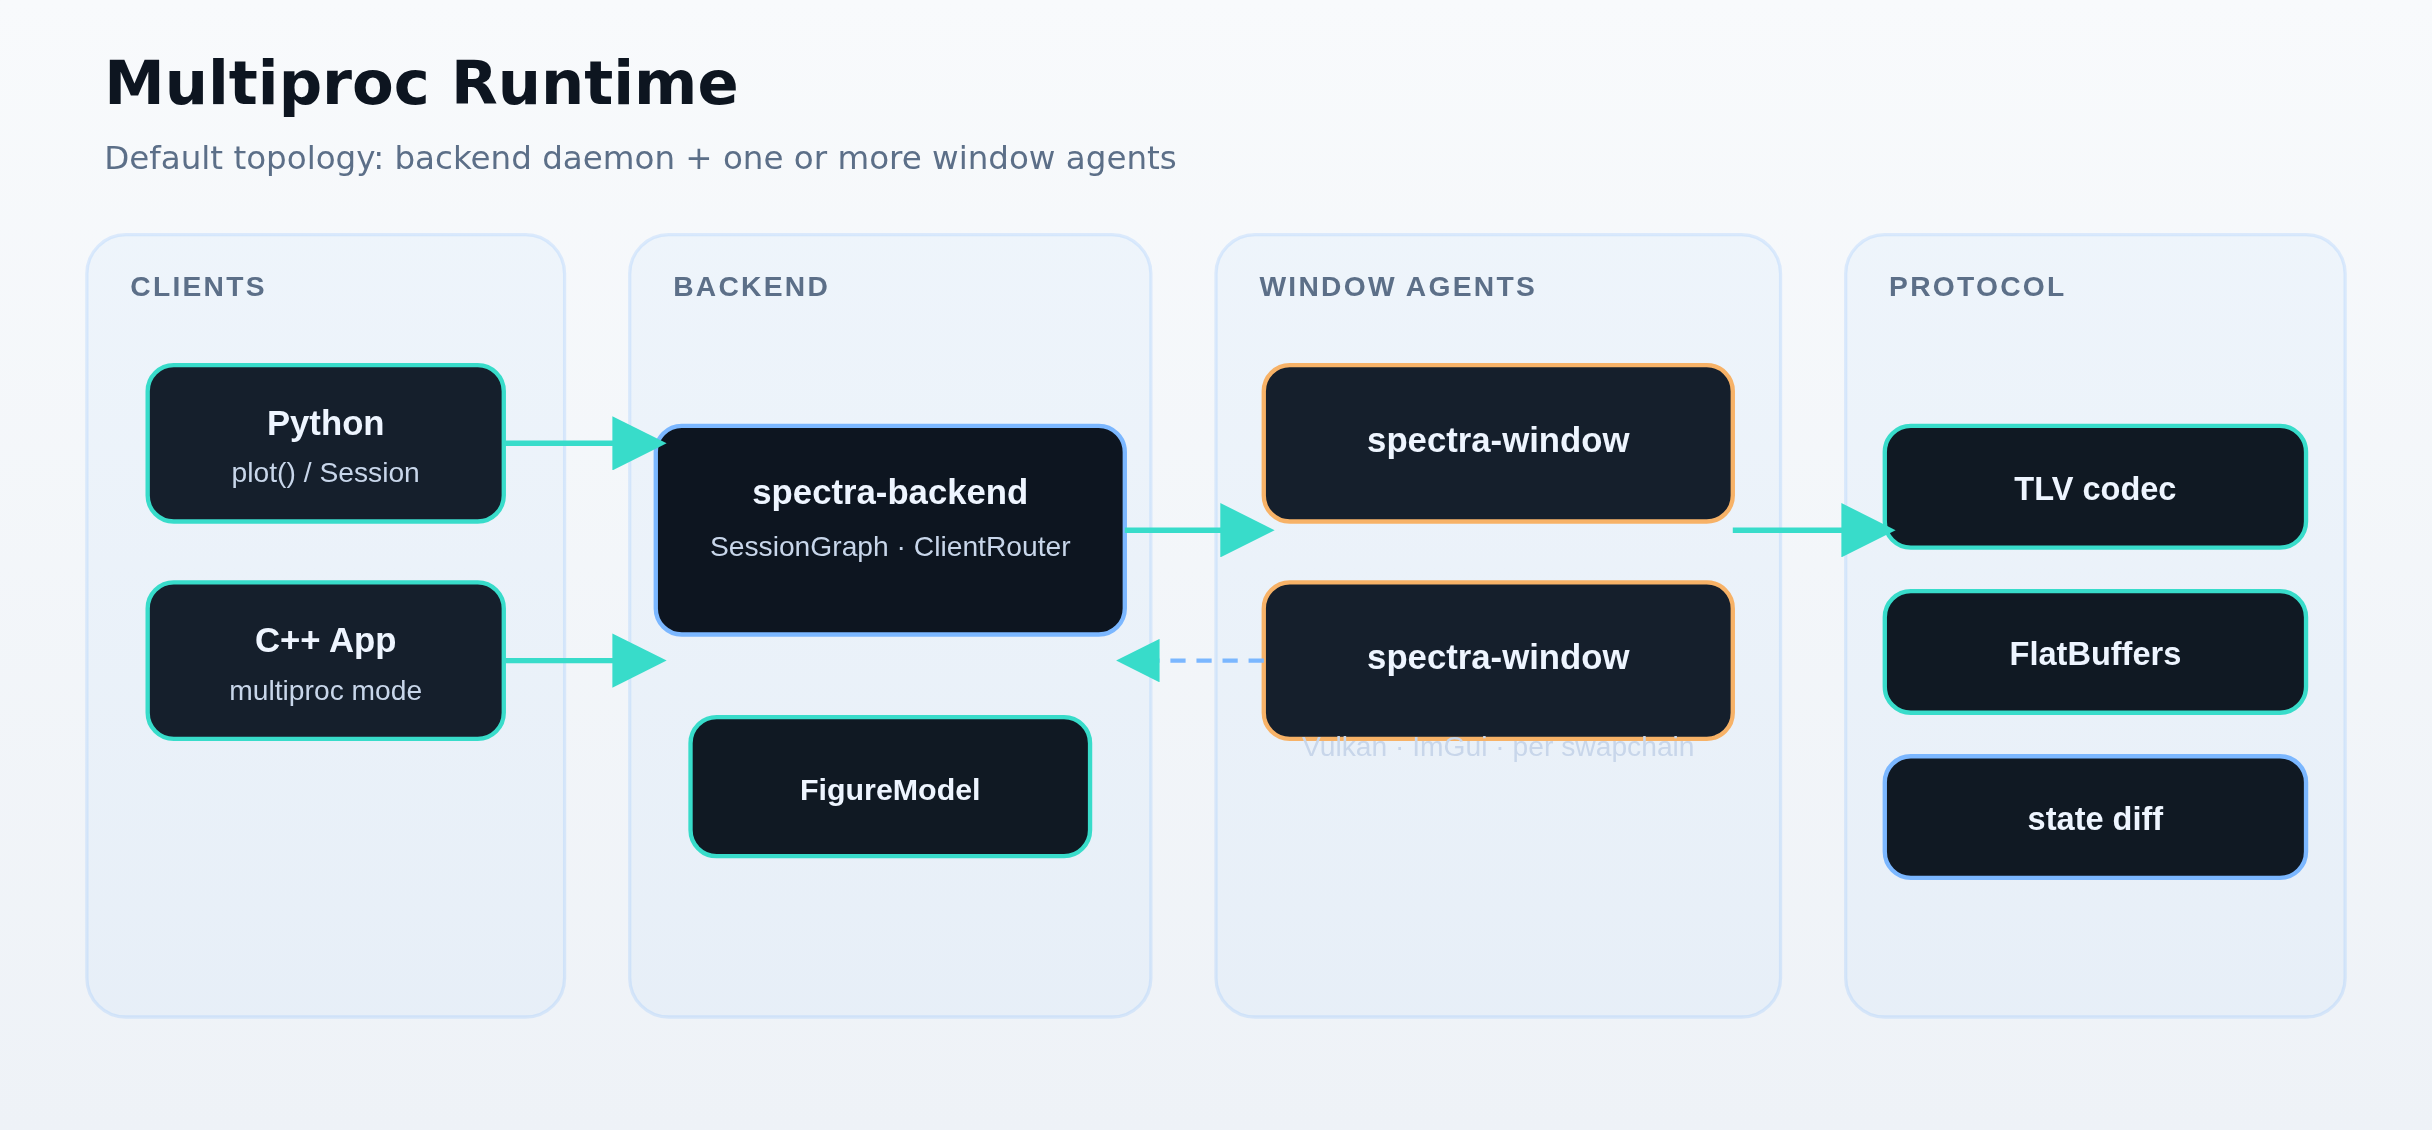
Python and C++ clients, backend daemon, window agents.
Explore diagrams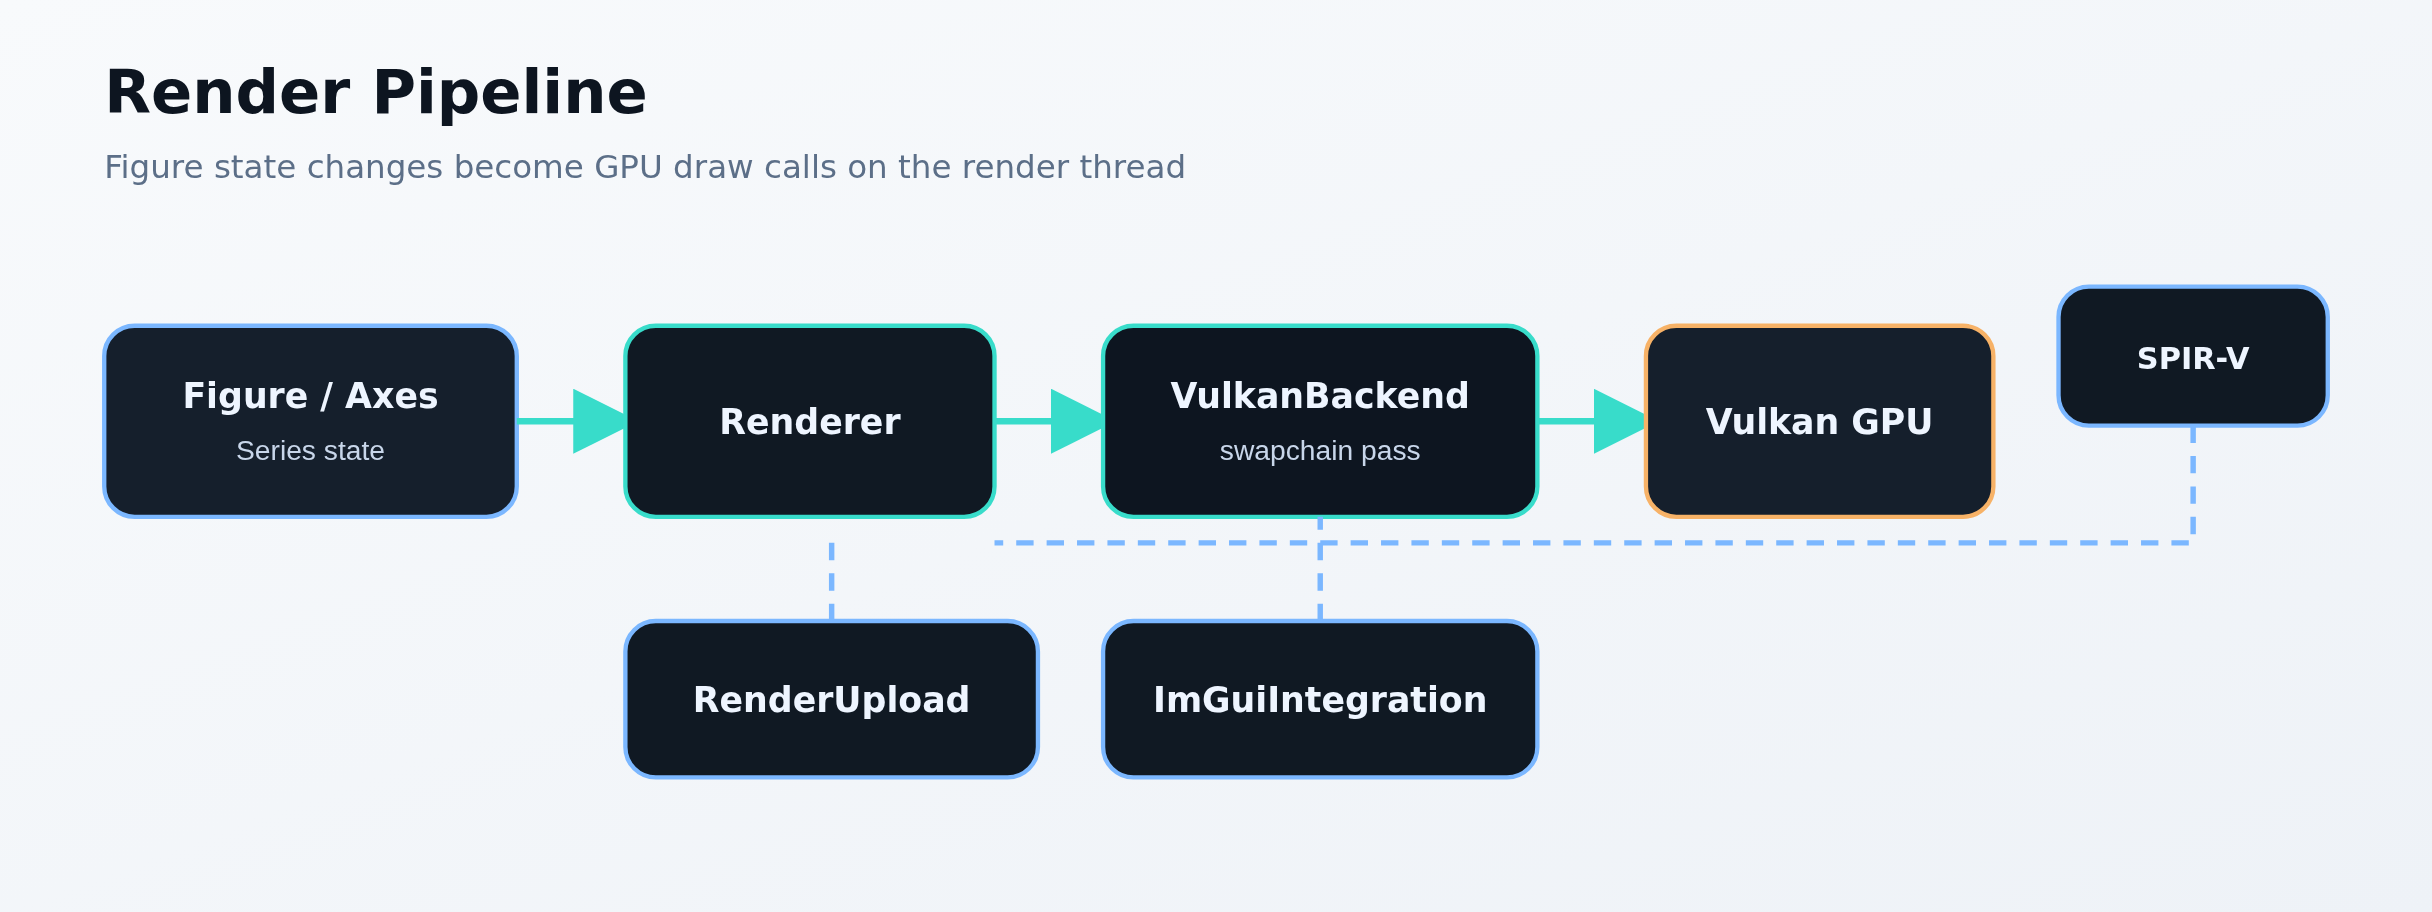
From figure state to SPIR-V shaders on the GPU.
Read pipeline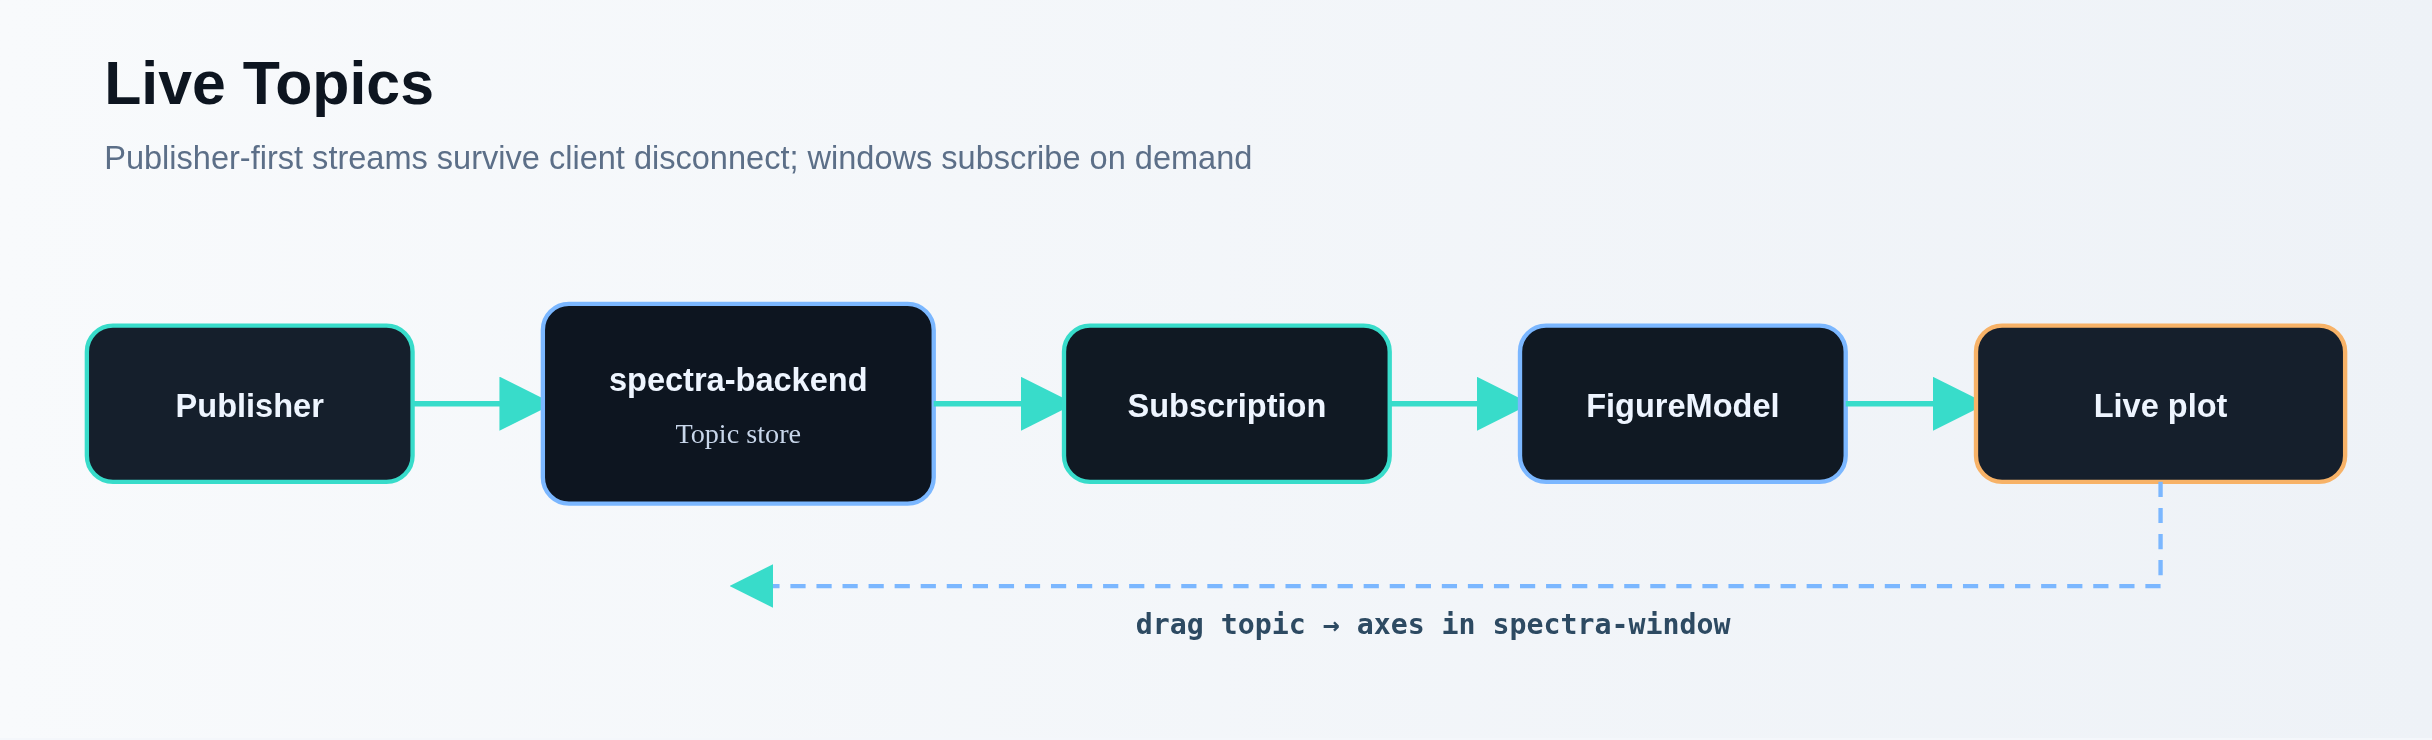
Publisher-first streams into any open window.
Topics guidePrefer smaller pages? Use these focused guides.
Install, build, and run your first C++ and Python plots.
Open guide →Complete capability matrix with APIs and key use cases.
View features →Recipe-style entry points mapped to repository examples.
Browse examples →Rendering pipeline, window model, and IPC runtime modes.
Read architecture →Core runtime, adapters, plugins, embed, and WebGPU.
View diagrams →GPU-accelerated ROS2 visualization — topic monitor, live plotting, bag tools, TF tree, node graph, and more.
View ROS2 docs →Standalone spectra-px4 for offline ULog browsing and live MAVLink telemetry.
Embed Spectra's Vulkan rendering inside a Qt6 application via QtRuntime.
Experimental WebGPU backend — same C++ code runs natively or in the browser.
View WebGPU docs →One-liner offscreen rendering for web services, batch reports, and notebooks.
Open guide →Write shared-library plugins for commands, transforms, overlays, data sources, and export formats.
Open guide →ROS-style named topics published into spectra-backend and plotted from any window.
"r--o")LineSeries3D, ScatterSeries3D, SurfaceSeries, MeshSeriesStart with one-liners, scale to full object control when needed.
plot(), scatter(), subplot()histogram(), bar(), box_plot(), violin()plot3(), scatter3(), surf(), mesh()figure(), tab())gcf(), gca(), cla())FigureIdspectra.plot(), spectra.scatter(), spectra.show()plot3(), scatter3(), surf(), mesh()find_package(spectra)#include <spectra/easy.hpp>
int main() {
std::vector<float> x = {0.f, 1.f, 2.f, 3.f};
std::vector<float> y = {0.f, 1.f, 0.5f, 1.5f};
spectra::plot(x, y, "c-o").label("example");
spectra::title("Spectra Feature Demo");
spectra::xlabel("X");
spectra::ylabel("Y");
spectra::show();
}For deeper usage, see the repository README and docs directory.